


")


Bitcoin falls into a technical no man’s land as major support levels sit miles away
Bitcoin is trading below key technical and onchain valuation levels, with historical bear market patterns suggesting a potential bottom closer to $45,000.


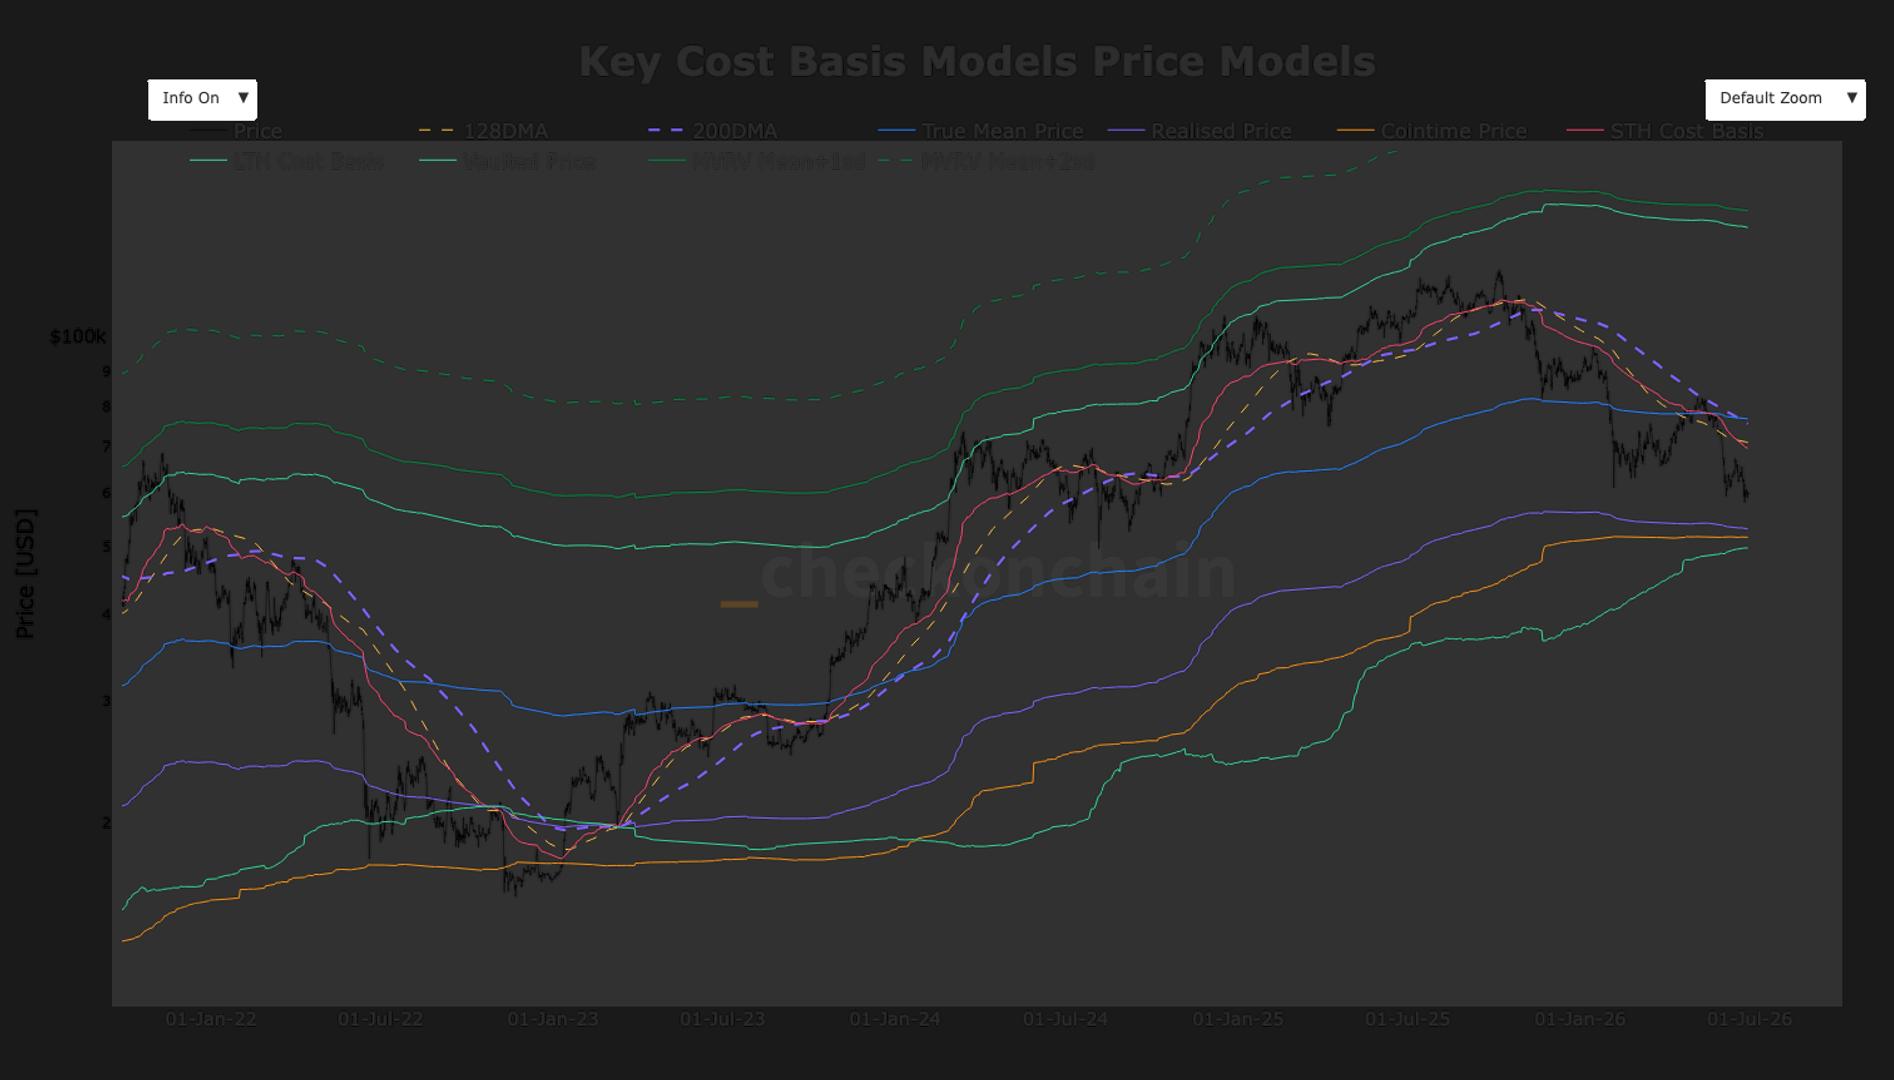
- Bitcoin remains below major resistance levels, including the True Mean Price, 200 Day Moving Average, 128 Day Moving Average, and the Short Term Holder Cost Basis, highlighting continued market weakness.
- Historical bear market cycles have seen bitcoin bottom 5-10% below major onchain valuation metrics, pointing to a potential downside target around $45,000.
Bitcoin BTC$60,303.71 is currently trading below $60,000, placing it in “no man’s land,” a zone where price sits between major on chain support and resistance levels. BTC has failed to reclaim several important technical and on chain thresholds, so the path of least resistance appears to remain to the downside.
Several key valuation metrics now sit above the current price. The True Mean Price, currently around $76,300, estimates the average acquisition cost of coins after adjusting for lost or inactive supply, providing a more accurate measure of the network’s economic cost basis.
The 200-Day Moving Average, at $75,500, is a widely followed technical indicator that smooths price action over the past 200 days and is often used to distinguish long term bull and bear trends. The 128-Day Moving Average, at $70,900, tracks bitcoin’s intermediate trend, while the Short Term Holder Cost Basis, at $69,600, represents the average purchase price of investors who have held bitcoin for less than roughly 155 days.
Several major onchain support levels lie below bitcoin’s current price. The Long Term Holder Cost Basis, at $49,900, reflects the average cost basis of investors holding bitcoin for more than 155 days. The Coin Time Price, at $51,700, measures bitcoin’s value after adjusting for the age and economic significance of coins, while the Realized Price, at $53,200, represents the average price at which all circulating bitcoin last moved onchain.
During previous major bear market lows, bitcoin has traded approximately 5-10% below these key on chain valuation metrics. If that historical relationship holds, it would imply a potential cycle bottom in the region of $45,000.
AI Disclaimer: Parts of this article were generated with the assistance from AI tools and reviewed by our editorial team to ensure accuracy and adherence to our standards. For more information, see CoinDesk’s full AI Policy.
The Evolution of the Crypto CEX Landscape: A Case Study on Binance


The Evolution of the Crypto CEX Landscape: A Case Study on Binance
Binance remains crypto’s leading exchange, expanding from spot and derivatives into RWAs, payments, savings, yield, and broader financial services.
Binance remains crypto’s leading exchange, expanding from spot and derivatives into RWAs, payments, savings, yield, and broader financial services.
Why it matters:
Binance remains crypto’s leading exchange, expanding from spot and derivatives into RWAs, payments, savings, yield, and broader financial services.


