")
Welcome to this weekly housing trends update, where we bring you the latest snapshot of inventory trends, listing activity, and buyer-seller dynamics across the U.S. housing market.
In addition to our monthly housing trends reports, which offer deeper insights into long-term patterns, we publish these weekly updates to provide more timely views into market changes. This effort began in response to rapid shifts in the economy and housing landscape.
You can count on a new Weekly Housing Trends Update, fresh weekly data each Thursday, and a weekly video from our economists to help you stay informed.
What this week’s data shows
Following a pause in reporting over the holidays, the first full weekly snapshot of 2026 arrives amid a shifting macroeconomic backdrop that is slightly more supportive of housing activity than it was late last year, but still far from robust. Mortgage rates have recently fallen to their lowest level since 2022, inflation has continued to moderate, and labor market data still point to stability rather than deterioration. Even so, these modest improvements have yet to translate into a meaningful reacceleration in housing demand, and the weekly data continue to reflect a market adjusting to slower conditions.
Lower mortgage rates near the low-6% range have helped put a firmer floor under home sales nationally, as seen in December’s pickup in existing-home sales. However, affordability remains stretched, and the legacy of rate lock-in continues to shape seller behavior. While a growing share of homeowners are now carrying mortgage rates above 6%, a sign that some households are beginning to move despite higher borrowing costs, the majority of owners still hold lower-rate loans, limiting the pace at which resale inventory can normalize.
Against this backdrop, the latest weekly housing data show a market where supply is gradually improving but demand remains cautious. Active inventory is higher than a year ago, homes are spending more time on the market, and listing prices continue to soften modestly. New listings have picked up compared to last year, suggesting sellers are testing the waters as rates ease and labor market conditions remain relatively steady. As 2026 gets underway, the housing market appears to be entering a phase defined less by sharp swings and more by slow, uneven adjustment- where improving macro conditions offer support, but affordability constraints and cautious buyer sentiment continue to cap upward pressure on prices.
Weekly housing trends highlights
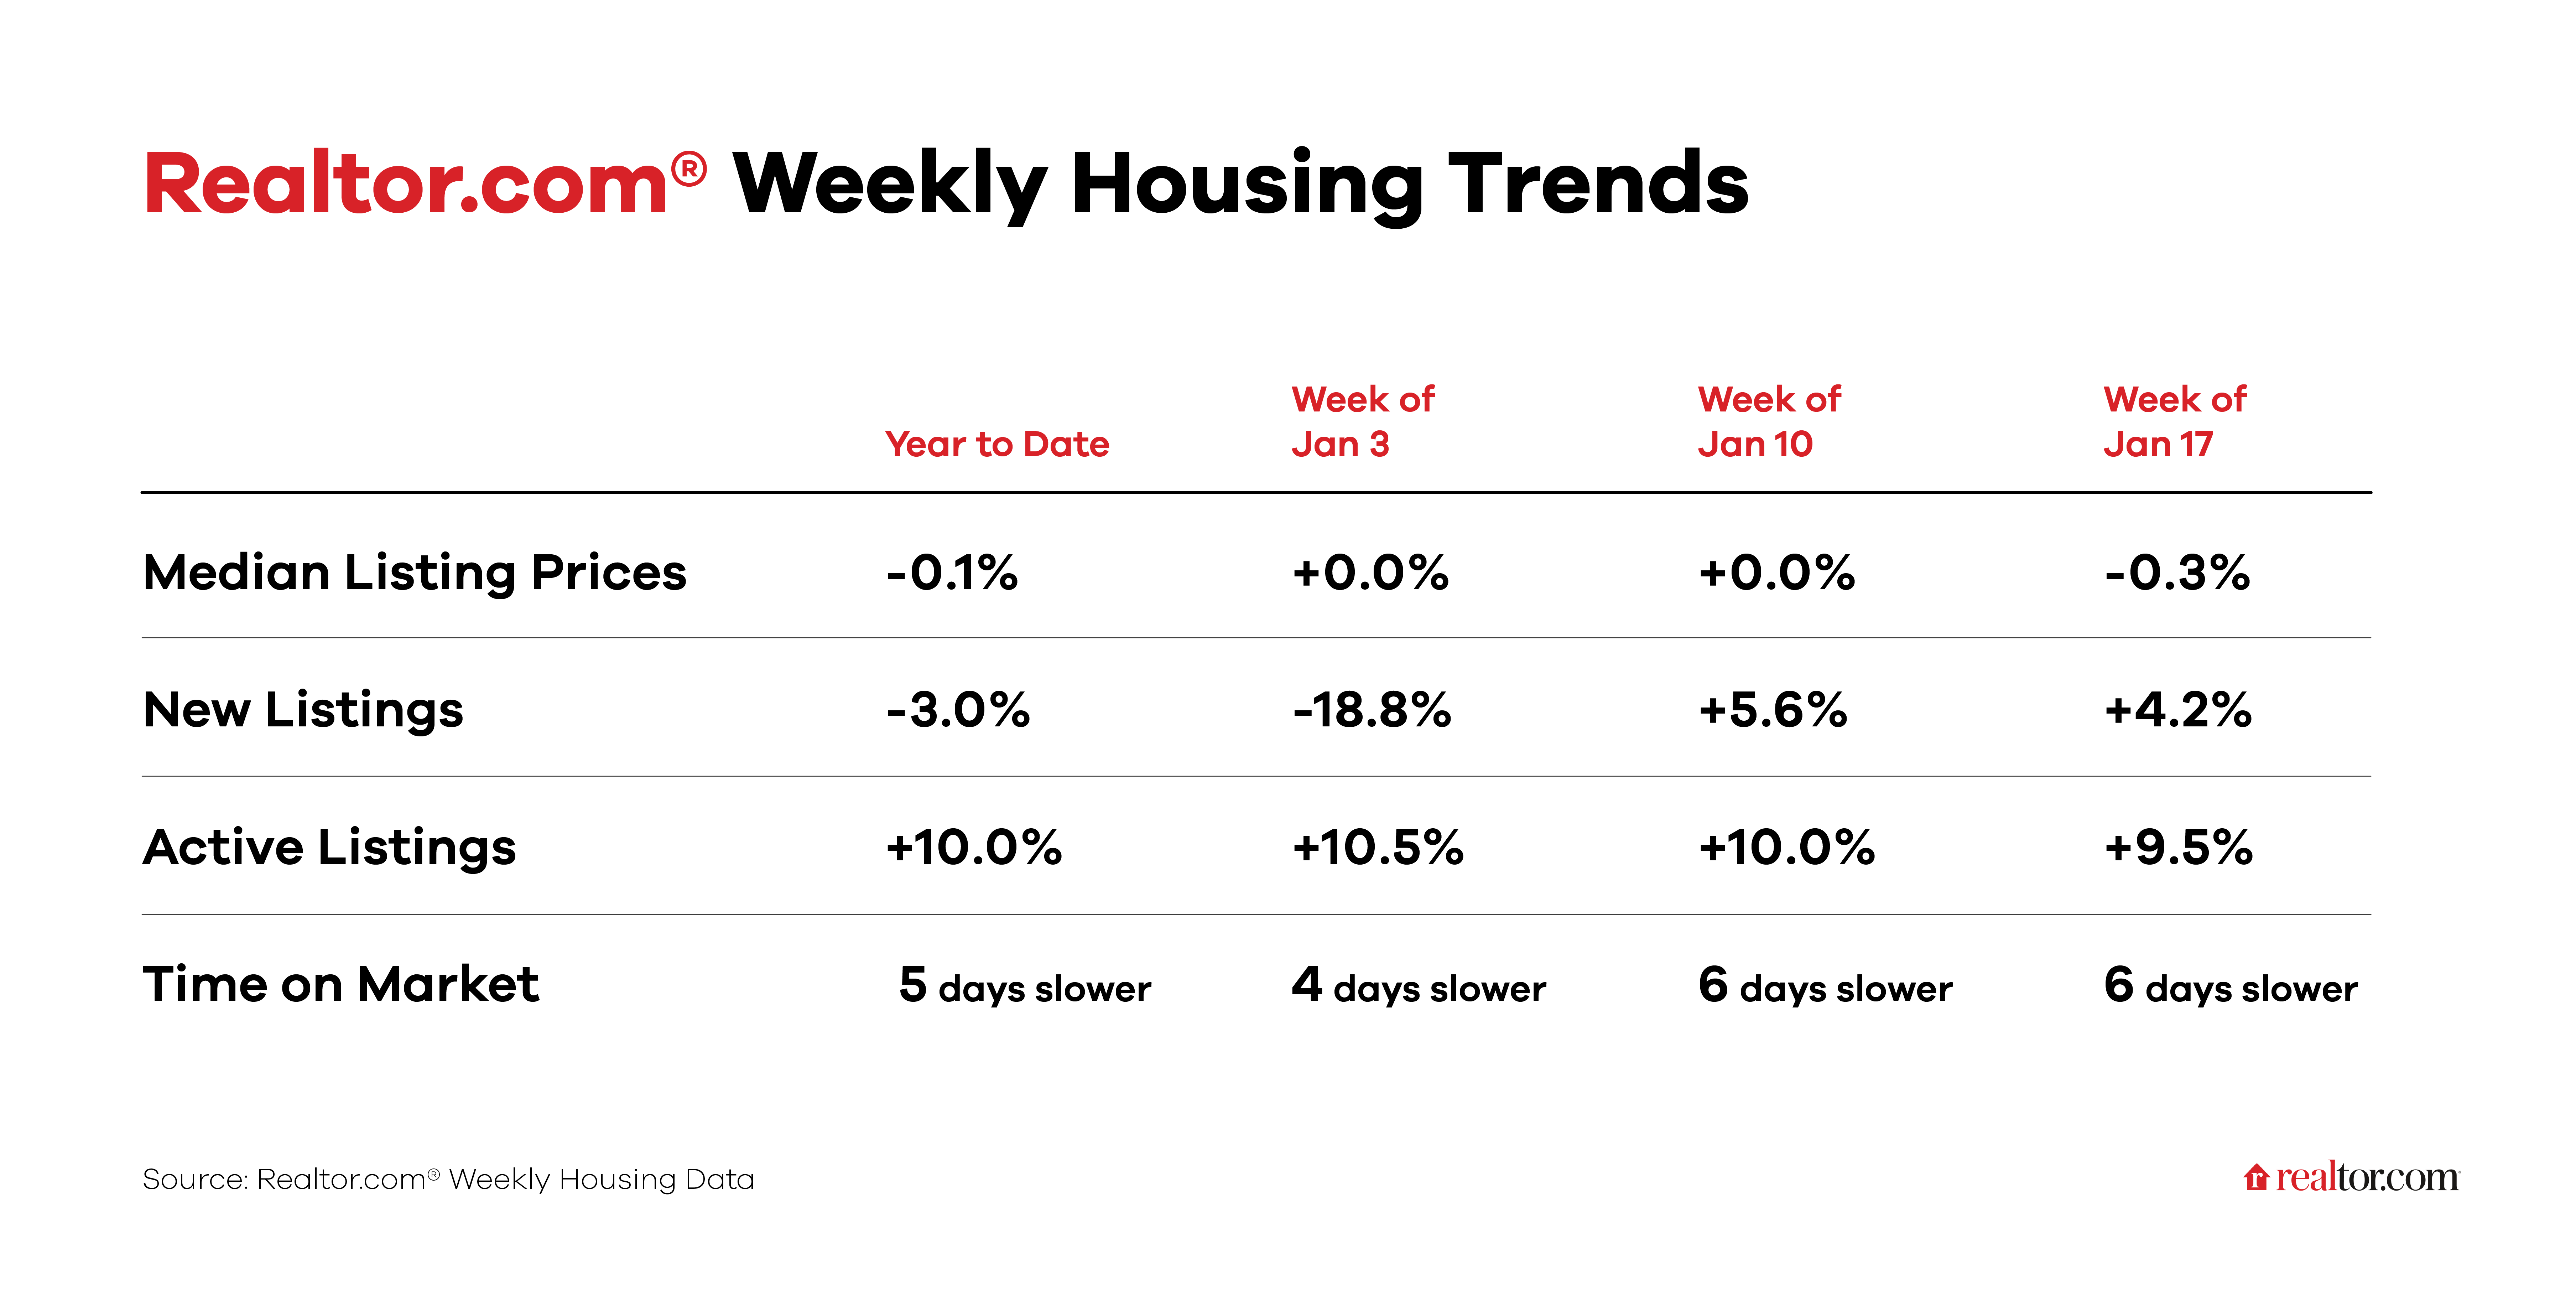
- New listings—a measure of sellers putting homes up for sale— rose 4.2% year over year
New listings increased compared to the same week last year, marking a modest rebound following the typical year-end slowdown. This uptick suggests that sellers are re-entering the market after the holidays, even as buyer demand remains restrained. While the gain is not large, it signals that supply growth in early 2026 is partially supported by fresh listings and not solely by homes lingering on the market. - Active inventory climbed 9.5% year over year
The number of homes for sale continues to run well above last year’s level, giving buyers more options than they had at this time in 2025. Inventory growth reflects both the rise in new listings and the slower pace of sales, as homes take longer to find buyers. Although inventory growth is less dramatic than at some points last year, it still underscores a market that remains less competitive for buyers. - Homes spent 6 days longer on the market than a year ago
Median days on market increased by nearly a week compared to last year, reinforcing signs of softer demand. Homes are taking longer to sell as buyers weigh their options and sellers face more competition. This extended time on market is consistent with a slower winter season, but the year-over-year gap suggests that the slowdown goes beyond normal seasonality. - The median listing price fell 0.3% year-over-year
Listing prices continue to drift lower compared to last year, though the decline is modest. The small year-over-year drop points to gradual price adjustments rather than widespread discounting. On a size-adjusted basis, the median listing price per square foot fell 1.8% year over year, indicating that price softness is more apparent once differences in home size and mix are taken into account.