








Key Takeaways
- SOL currently trades between $74 and $76, experiencing a decline of more than 3% over the last 24 hours with trading volume reaching $1.65B
- Technical analyst Ali Martinez identifies a monthly TD Sequential “9” buy indicator on Solana’s price chart
- Liquidation data reveals long position holders suffered losses of $13.06M out of a total $14.37M in 24-hour liquidations
- Crypto Patel maintains that SOL’s long-term projection of $500 stays intact provided price action remains above the 0.5 Fibonacci retracement
- Critical resistance and support zones: $77.35 marks the bullish flip level, while $70–$75 represents crucial support territory
Solana (SOL) is currently positioned at $75.97, showing a 1.49% increase over the previous 24-hour period. The digital asset has generated $1.88 billion in daily trading activity, maintaining a market capitalization of $44.26 billion.

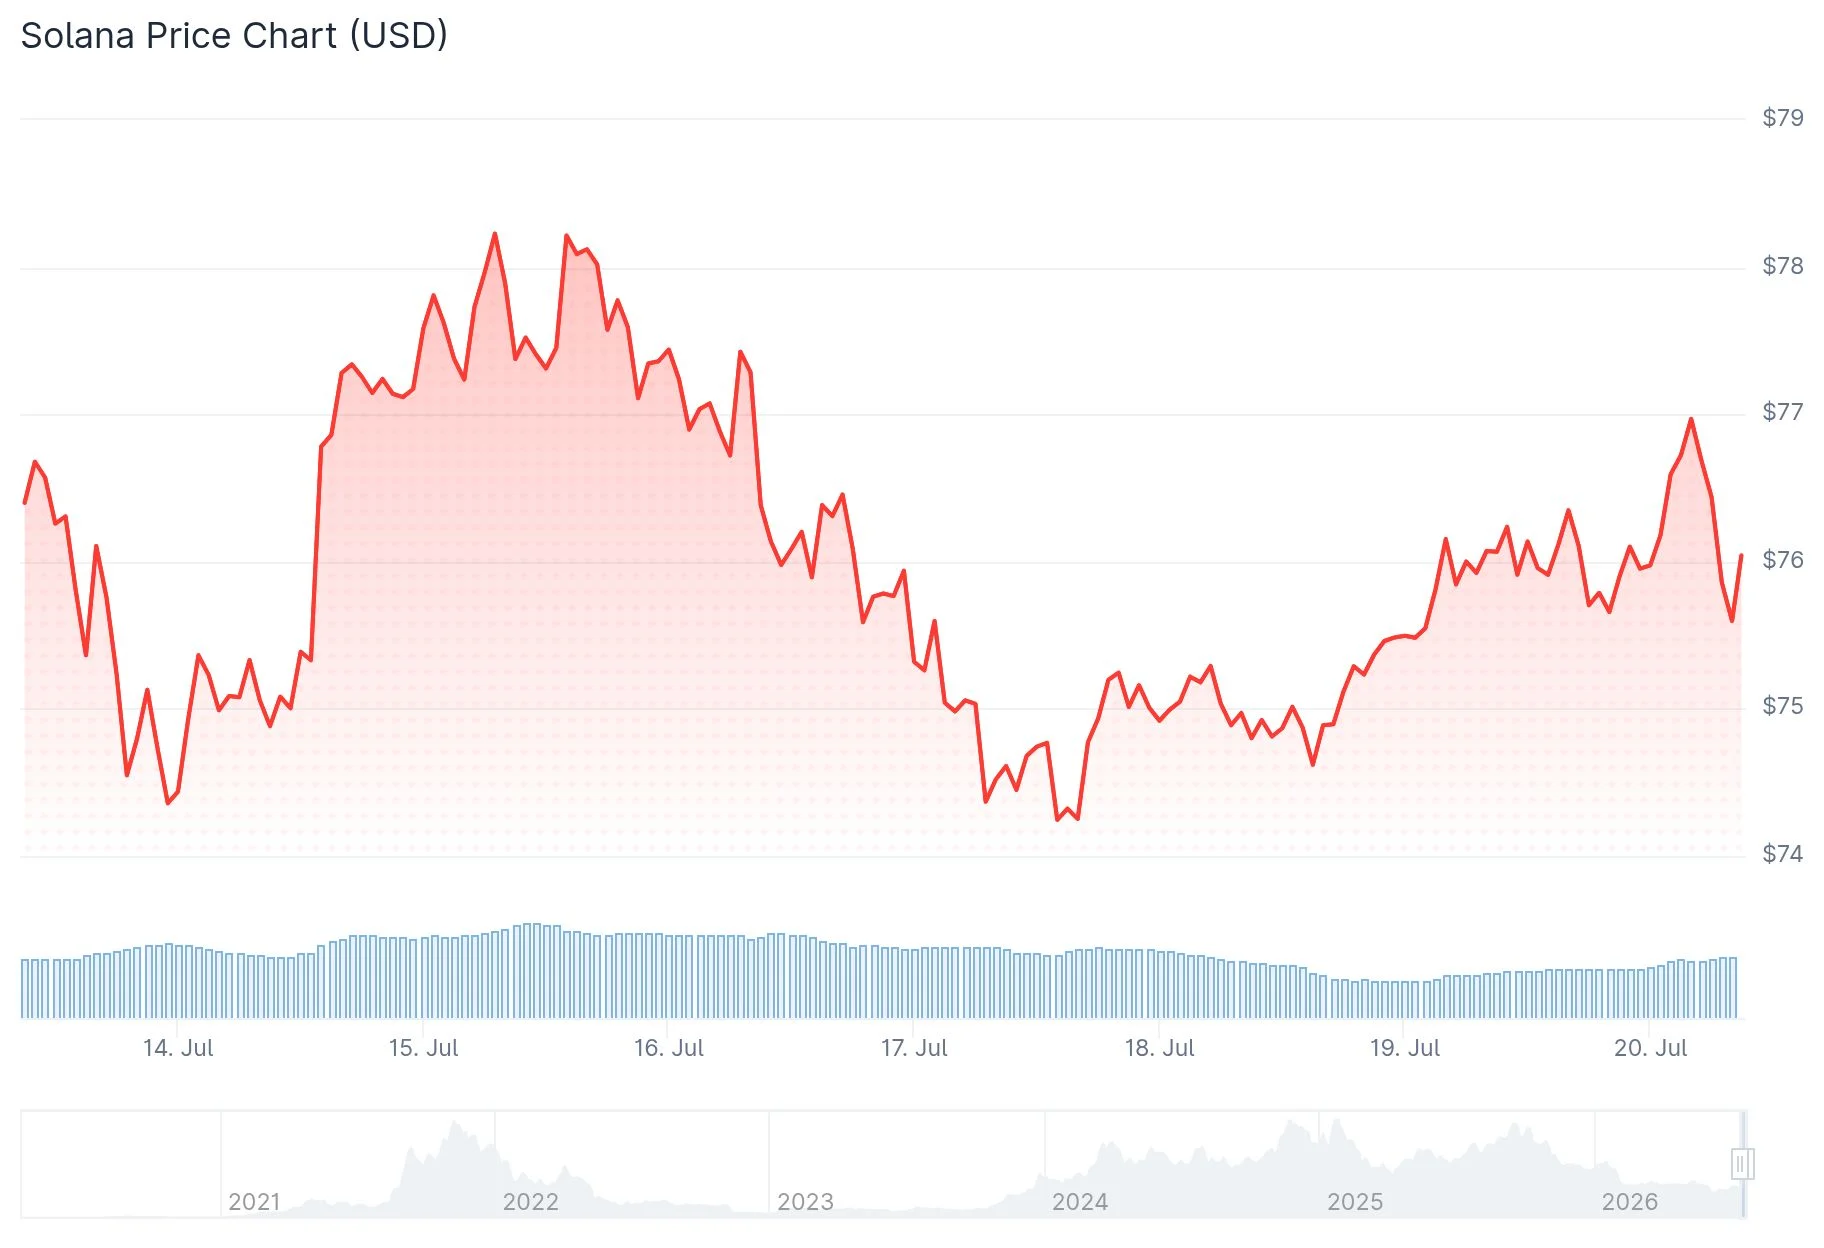
While SOL has experienced a modest bounce, the asset remains in negative territory with a 5.9% decline across the seven-day window and an 8.9% decrease over two weeks. However, the cryptocurrency maintains a positive 2.6% gain on the monthly timeframe.
Technical analyst Ali Martinez has identified a significant monthly TD Sequential “9” buy indicator on Solana’s price chart. This technical formation emerged following a substantial downturn from above $245 in late 2024 to approximately $76.62.
The TD Sequential indicator has materialized after a prolonged bearish phase and suggests diminishing selling pressure. Technical signals occurring on monthly charts typically carry greater significance compared to those appearing on shorter time intervals.
To confirm the bullish setup, SOL must recapture the $80–$85 price range. A decisive monthly closure above $100 would provide stronger evidence of a macro trend reversal. Conversely, a breakdown below the $70–$75 zone would compromise the bullish thesis and potentially trigger a move toward $60.
Critical Fibonacci Retracement Supports Long-Term Price Projection
Market analyst Crypto Patel maintains that Solana’s ambitious $500 price projection remains achievable, contingent upon maintaining support above the 0.5 Fibonacci retracement threshold. This technical level is viewed as a fundamental component of the asset’s broader market architecture.
Maintaining price action above the 0.5 Fibonacci retracement typically indicates that the underlying uptrend remains structurally intact, despite interim pullbacks.
Examining the near-term one-hour timeframe reveals a bearish technical formation. The entry range is positioned between $76.45 and $76.70, with projected downside objectives at $75.70, $74.30, and $73.60.
This bearish near-term configuration remains effective provided SOL continues trading beneath $77.30. A decisive break and close above $77.35 would negate the bearish scenario.
Long Position Holders Bear Brunt of Market Liquidations
Data from CoinGlass indicates that traders holding long positions sustained the majority of recent market losses. Aggregate SOL liquidations spanning 24 hours totaled $14.37 million. Long position liquidations comprised $13.06 million — representing approximately 91% of total forced closures.
Within a 12-hour window, long traders experienced $7.66 million in liquidations compared to $1.07 million for short positions.
In a separate technical development, Solana’s SuperTrend indicator on the three-day chart shifted to bullish on July 12 — marking the first buy signal since October 10.
During the period spanning July 3 to July 11, exchange reserves decreased by 100 million SOL tokens. Simultaneously, the Solana network welcomed 1.4 million new wallet addresses, according to data provided by Token Terminal.
Solana continues trading within a significant historical volume cluster that extends between present price levels and a wider macro expansion zone.


