








Key Highlights
- Ethereum is currently trading at $1,867.98 following a decisive break above the critical $1,820 resistance level
- Market analysts project a potential move toward $2,500 if current support levels remain intact
- Major whale wallets liquidated 72 BTC to establish leveraged long positions totaling 12,000 ETH
- Spot Ethereum ETFs attracted $105 million in cumulative net inflows during the week of July 13–17
- Extended chart projections suggest potential targets of $4,865, $6,089, and eventually $8,300–$10,000
Ethereum has successfully breached a significant resistance barrier around $1,820, with the cryptocurrency now changing hands at $1,867.98. Daily trading volume has reached $6.63 billion, while the network’s market capitalization stands at $225.48 billion.

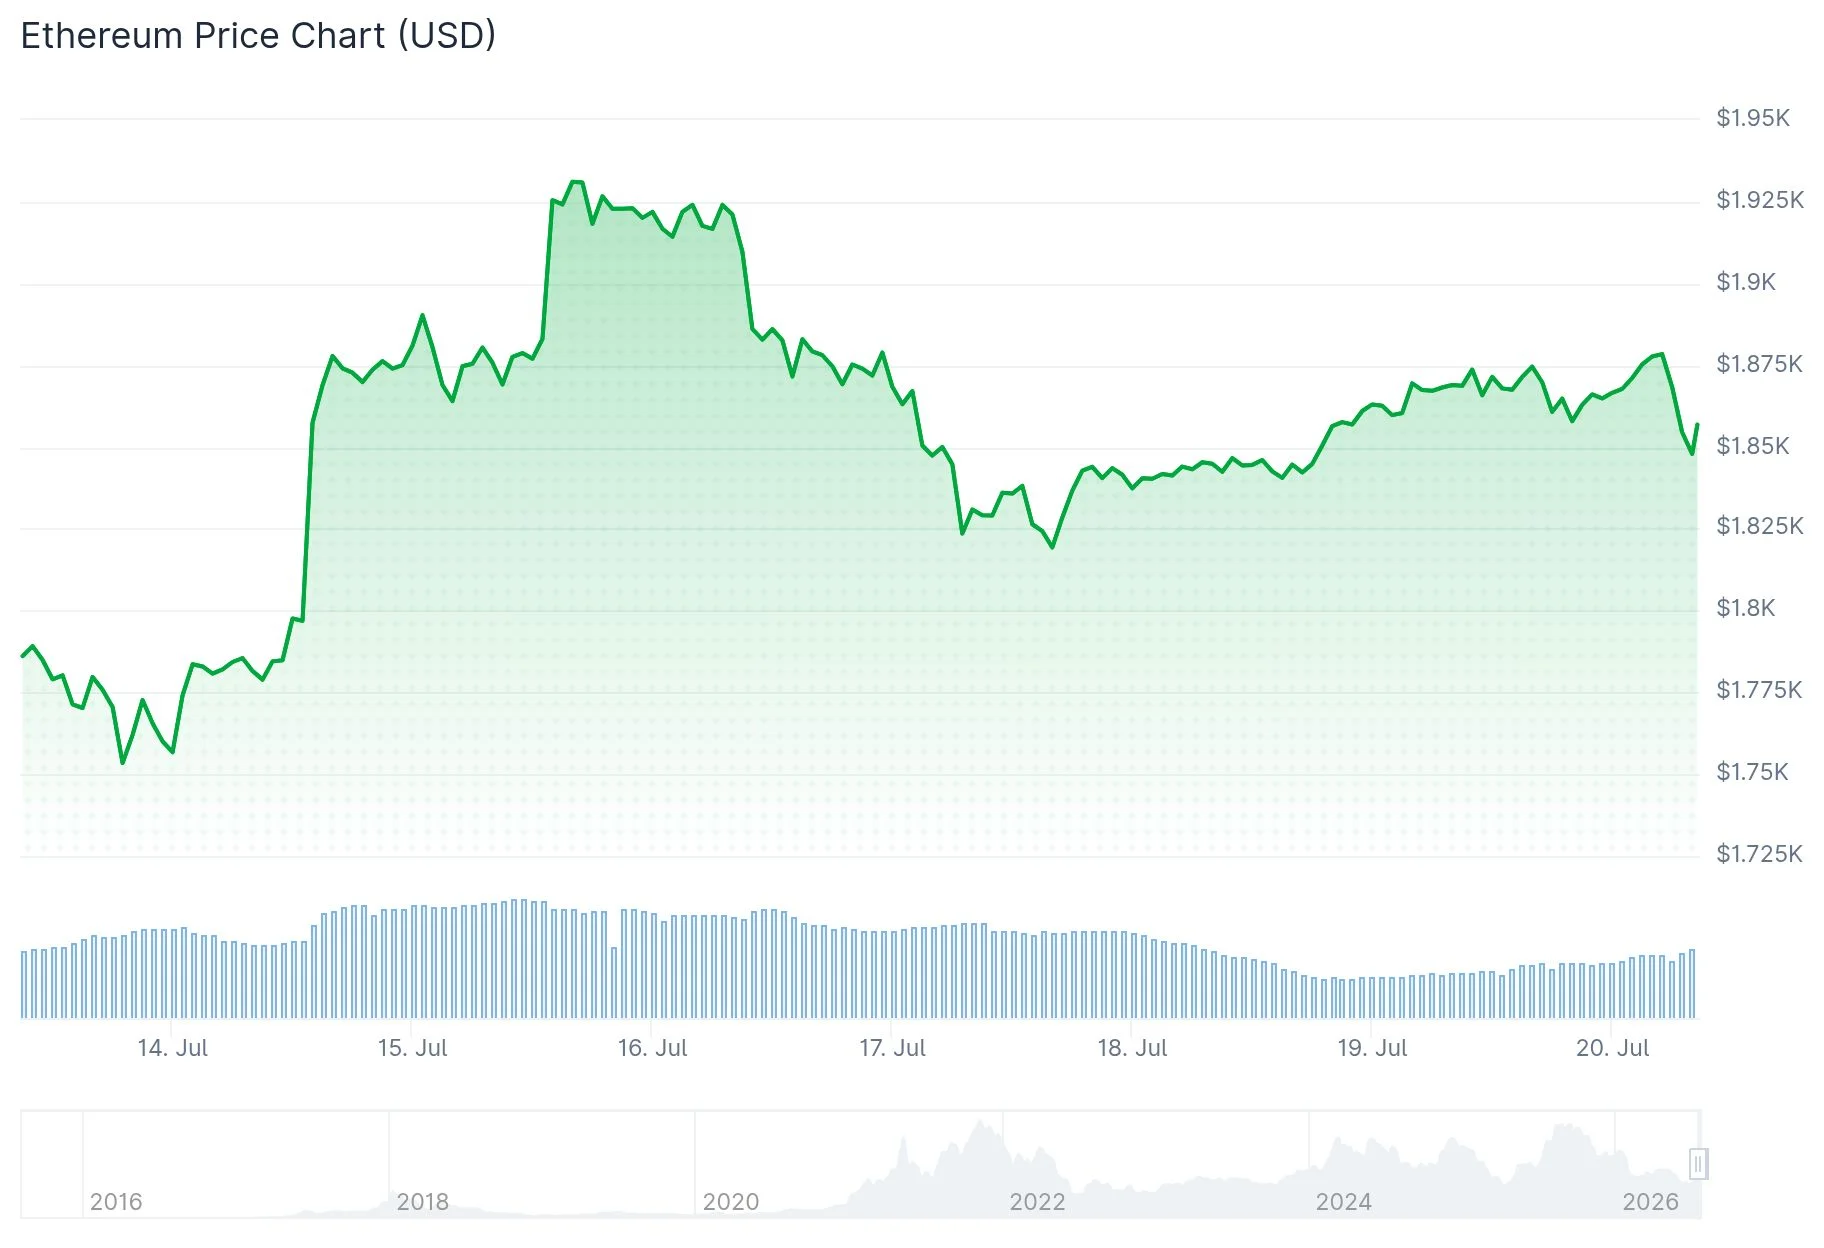
This upward movement represents a 1.60% increase during the past 24-hour period. Market participants successfully defended the breakout zone when price action retested the area, a development that technical analysts view as reinforcing the bullish narrative.
Cryptocurrency analyst Michael van de Poppe observed that Ethereum has transitioned into a more favorable technical setup following its clearance of the $1,820 barrier. He emphasized that maintaining price action above this threshold solidifies positive sentiment throughout the broader cryptocurrency market.
This is the right direction for $ETH.
It broke above the resistance zone of $1,820.
Quick retest of that area for support and currently holding above it.
The path is really simple: if this holds, then we’re going to see a run towards $2,500.
Most likely, the Clarity Act will… pic.twitter.com/AEvOAa86Ov
— Michaël van de Poppe (@CryptoMichNL) July 19, 2026
Market analysts suggest Ethereum could advance toward the $2,500 price point assuming current support zones hold firm and accumulation activity intensifies. Market participants are simultaneously monitoring the forthcoming Clarity Act, which is anticipated to be introduced in the coming week.
Examining the weekly timeframe, Ethereum is positioned at the 0.618 Fibonacci retracement level near $1,843. This identical technical level previously sparked a substantial rally in May 2025, during which ETH advanced from approximately $1,379 to nearly $4,865.
Ethereum temporarily declined to $1,510 before recovering to this Fibonacci support zone. Maintaining price action above $1,843 on a sustained basis would represent the initial confirmation signal for an extended recovery trajectory.
Large Holder Activity Supports Bullish Thesis
Blockchain analytics platform Lookonchain has identified two recently created wallet addresses that liquidated a combined 72 BTC before establishing leveraged long positions encompassing 12,000 ETH. This capital rotation from Bitcoin into Ethereum is attracting significant attention from market participants regarding its influence on overall sentiment.
Although substantial leveraged positions introduce liquidation vulnerability, the magnitude of this transaction demonstrates considerable confidence in Ethereum’s short-term price appreciation potential.
Market analyst Daan Crypto Trades highlighted on X that the ETH/BTC trading pair has been steadily climbing, which could provide tailwinds for tokens within the Ethereum ecosystem. He emphasized that nearly twelve months have elapsed since Ethereum demonstrated genuine relative strength versus Bitcoin, describing the current price zone as critical — particularly with Bitcoin simultaneously establishing support.
$ETH These are the high timeframe levels where you should start paying close attention.
If this move sustains into next week and ETH/BTC keeps grinding higher, that should bode well for many primarily ETH ecosystem coins.
It’s been almost a year since ETH put in any real… https://t.co/7nf4nvJ5Dx pic.twitter.com/Pp9kvkquH9
— Daan Crypto Trades (@DaanCrypto) July 19, 2026
Exchange-Traded Fund Inflows Strengthen Upward Momentum
Data reported by Wu Blockchain indicates that Ethereum spot exchange-traded funds registered $105 million in cumulative net inflows throughout the July 13–17 trading week. This persistent institutional allocation provides an additional foundation supporting the current price architecture.
Ethereum Spot ETFs Recorded $105M in Net Inflows Last Week
From July 13 to 17 (ET), Ethereum spot ETFs recorded net inflows of $105 million, Bitcoin spot ETFs $75.67 million, SOL spot ETFs $948,200, and XRP spot ETFs $6.78 million, while HYPE spot ETFs saw $7.26 million in net… pic.twitter.com/SMyaIyrQBH
— Wu Blockchain (@WuBlockchain) July 20, 2026
Analyzing extended timeframes, a validated breakout from the multi-year triangular consolidation pattern would establish an initial objective in the $4,865–$4,900 range. Subsequently, Fibonacci extension calculations indicate $6,089 as a secondary target, with long-term projections approaching $9,145.
Ethereum must successfully recapture moving average resistance within the $2,400–$2,900 corridor before the overarching technical structure transforms into an unambiguously bullish configuration.
A weekly candle close beneath $1,510 would compromise the current technical setup and indicate the corrective phase remains incomplete.
Ethereum is presently valued at $1,867.98.


