


You are here: Home / Cryptocurrency News / ADA Price Analysis: Cardano Eyes Breakout as $0.25 Support Holds


ADA price analysis for May 9 shows Cardano’s latest rebound has brought market focus back to a major support zone. Traders are watching whether the token can hold its recovery structure as spot activity, derivatives data, and technical indicators improve.
As of writing, Cardano (ADA) is trading at $0.2730, showing a 3.3% increase in the past day. The trading volume is up by 12.91% and is currently standing at $474.54 million. Over the last week, the coin price has risen by 9.98%, according to CoinMarketCap.
Also Read: Bitcoin Dominance Holds 60% as Market Consolidates Near $1.61 Trillion
ADA Price Holds Critical $0.25 Support Level
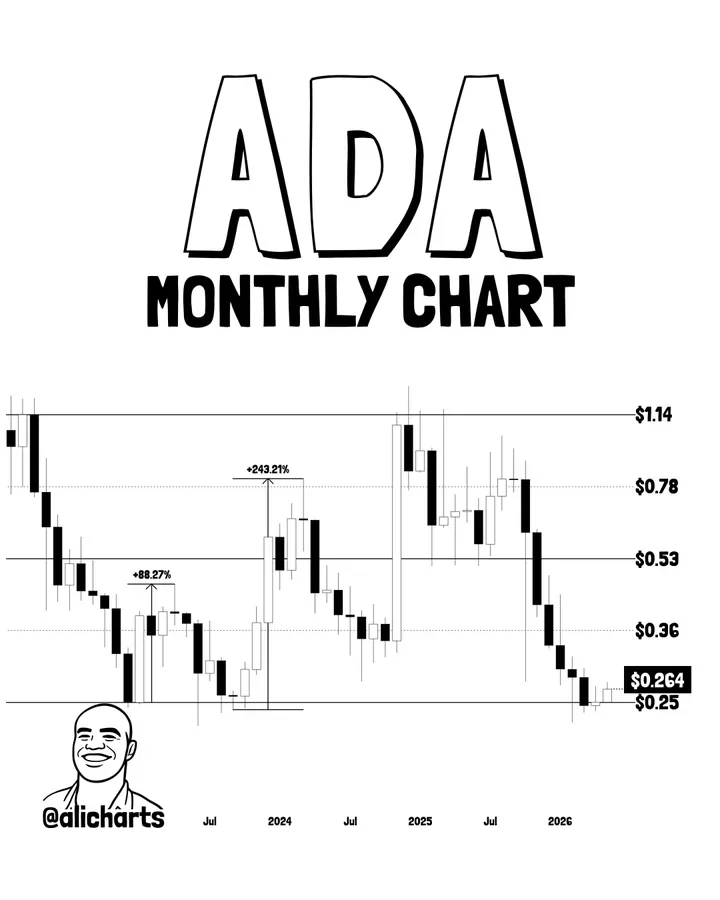
Market focus has turned to the $0.25 level. Crypto analyst Ali Martinez highlighted that this zone is crucial for Cardano’s support. He pointed out that the same floor has played a big role in key rebounds in the past market cycles.
Martinez pointed to the monthly chart. In January 2023, ADA rebounded from $0.25 and later gained 88.27%. The same zone was held in September 2023, followed by a 243% price jump.
He noted that Cardano has now returned to its reaction phase again. If ADA continues to support at this level, his first target is $0.36. His secondary macro target is at $0.53.

He also expressed caution on the downside. A $0.25 drop would be a sign of a more significant trend reversal. It may also pave the way towards a bigger correction.
According to Coinlore data, the price of $0.2483 recently served as a short-term support level. The first resistance level stands at $0.3119. If it rises from there, the next resistance level will be around $0.3508.
The third resistance level is seen at $0.3851. These levels provide a trader with a definite range to observe. The present price is still under the initial major resistance area.
Derivatives Activity Rises as Open Interest Climbs
Additionally, ADA price analysis indicates greater activity in the derivatives market. CoinGlass data shows the future volume increased 10.20% to $602.39 million. Open interest rose 6.51% to $557.80 million. The ADA OI-Weighted Funding Rate is at 0.0066%.
ADA Price Analysis Shows EMA and BB Recovery Signals
From a technical perspective, the daily Exponential Moving Average (EMA) data shows short-term improvement. ADA trades above the 20-day EMA at $0.2566. It also stayed above the 50-day EMA at $0.2578.
Resistance is still seen ahead on the longer time frame EMA levels. The 100-day EMA stood at $0.2846. The 200-day EMA is higher at $0.3659.
The Bollinger Bands (BB) show that ADA is in the upper zone. The upper Bollinger Band is at $0.2846. The middle BB is at $0.2535, and the lower Bollinger Band stands at $0.2362.
However, ADA price analysis shows Cardano holding above an important support area. A break above $0.3119 would be a positive change in the recovery structure. If it drops below $0.25, it would create a weak setup.
This article contains market analysis and price predictions. These are not guarantees. Crypto markets are volatile. Always DYOR. Not financial advice.
Also Read: SEI Price Prediction: Breakout Formation Targets $0.76 as Bulls Regain Control


About Yahya Raza Sherazi
Yahya Raza is a Technology Analyst at Tronweekly, covering cryptocurrency markets, blockchain-related developments, and digital asset regulations. He has over one year of experience reporting on Bitcoin, altcoins, and broader crypto market trends.
His reporting focuses on market movements, crypto scams and hacks, security-related incidents, and regulatory developments, examining how technological risks and policy actions impact the crypto ecosystem. Yahya tracks ongoing market activity and industry updates using verified data and official sources.
Yahya’s work is written for both beginners and experienced readers, with an emphasis on clear, accurate reporting on crypto markets, technology-related risks, and regulatory changes, without speculation or investment guidance.


