

- USD/CHF up 0.12% but trades below 20- and 50-day SMA confluence at 0.8019/23, keeping sellers in control.
- RSI bearish but flat, suggesting near-term consolidation unless breakout above 0.8000 or drop below 0.7900 occurs.
- Upside targets include 0.8025 and 100-day SMA at 0.8109; downside risks point to yearly low at 0.7872.
USD/CHF advanced during the North American session, yet it remains consolidating at around the 0.7950-0.8000 range ahead of the next week Federal Reserve’s monetary policy meeting. The pair trades at 0.7966 up 0.12%.
USD/CHF Price Forecast: Technical outlook
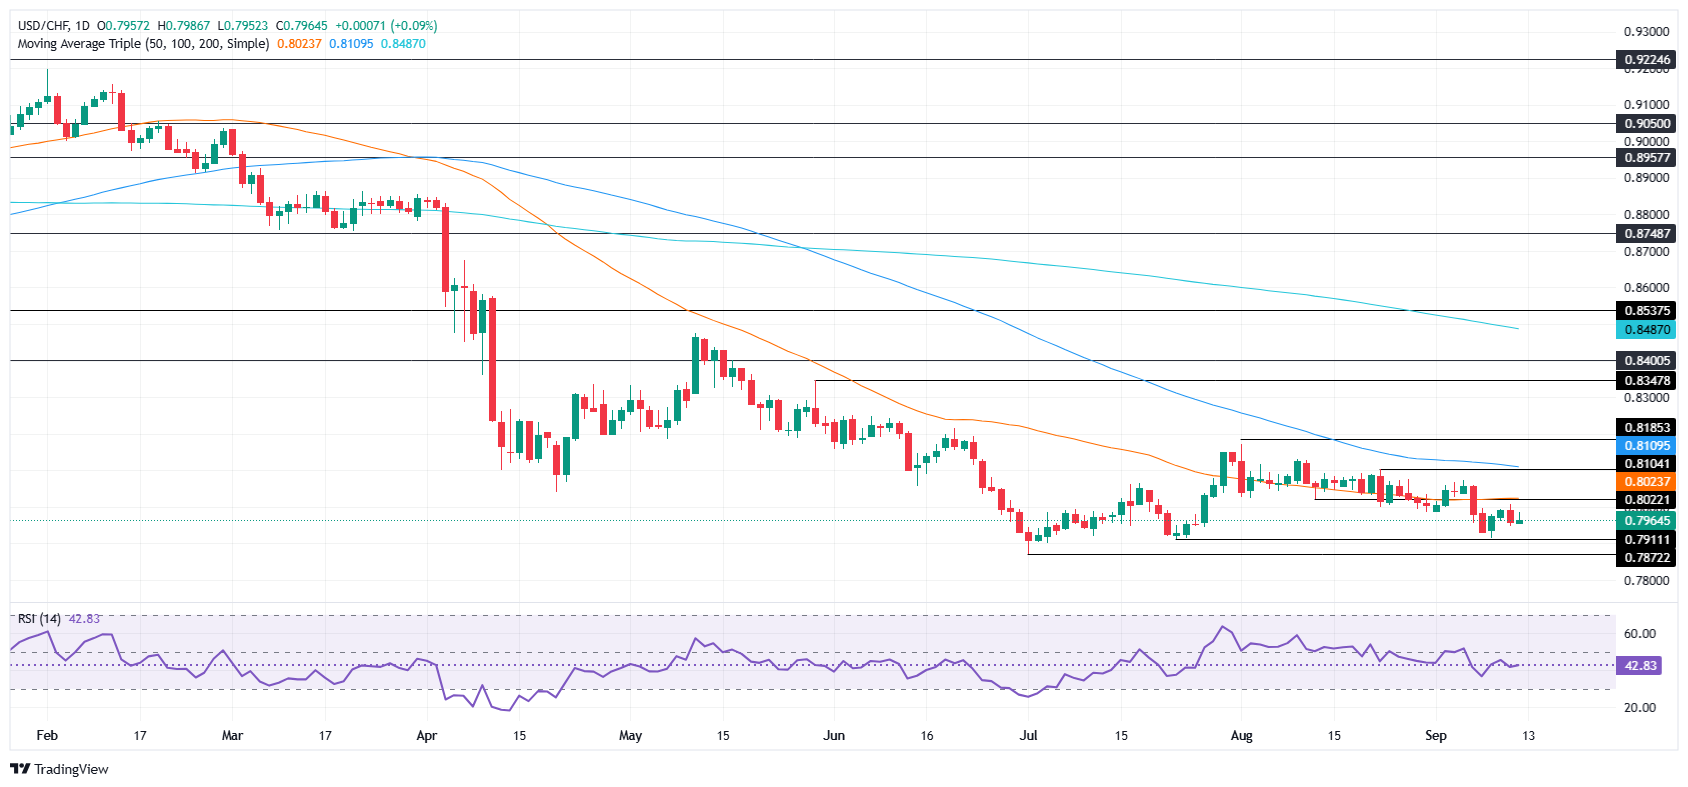
The USD/CHF daily chart shows that price action is poised to test yearly lows. Spot prices remain below the 20 and 50-day Simple Moving Averages (SMAs) confluence at 0.8019/23, an indication that sellers remain in charge.
The Relative Strength Index (RSI) is bearish, but flatlined. This means that the USD/CHF could be directionless in the short-term, unless the pair clear key support/resistance levels.
On the upside, if USD/CHF climbs above 0.8000, the next ceiling level would be 0.8025, before aiming towards the 100-day SMA at 0.8109. Conversely, a drop below 0.7900 would sponsor a test of the yearly low of 0.7872.
USD/CHF Price Chart — Daily
Swiss Franc Price This week
The table below shows the percentage change of Swiss Franc (CHF) against listed major currencies this week. Swiss Franc was the strongest against the Canadian Dollar.
| USD | EUR | GBP | JPY | CAD | AUD | NZD | CHF | |
|---|---|---|---|---|---|---|---|---|
| USD | -0.17% | -0.39% | -0.41% | 0.09% | -1.46% | -1.03% | -0.28% | |
| EUR | 0.17% | -0.23% | -0.14% | 0.29% | -1.29% | -0.81% | -0.11% | |
| GBP | 0.39% | 0.23% | 0.00% | 0.50% | -1.06% | -0.57% | 0.16% | |
| JPY | 0.41% | 0.14% | 0.00% | 0.42% | -1.10% | -0.80% | 0.17% | |
| CAD | -0.09% | -0.29% | -0.50% | -0.42% | -1.45% | -1.07% | -0.34% | |
| AUD | 1.46% | 1.29% | 1.06% | 1.10% | 1.45% | 0.48% | 1.24% | |
| NZD | 1.03% | 0.81% | 0.57% | 0.80% | 1.07% | -0.48% | 0.75% | |
| CHF | 0.28% | 0.11% | -0.16% | -0.17% | 0.34% | -1.24% | -0.75% |
The heat map shows percentage changes of major currencies against each other. The base currency is picked from the left column, while the quote currency is picked from the top row. For example, if you pick the Swiss Franc from the left column and move along the horizontal line to the US Dollar, the percentage change displayed in the box will represent CHF (base)/USD (quote).
Information on these pages contains forward-looking statements that involve risks and uncertainties. Markets and instruments profiled on this page are for informational purposes only and should not in any way come across as a recommendation to buy or sell in these assets. You should do your own thorough research before making any investment decisions. FXStreet does not in any way guarantee that this information is free from mistakes, errors, or material misstatements. It also does not guarantee that this information is of a timely nature. Investing in Open Markets involves a great deal of risk, including the loss of all or a portion of your investment, as well as emotional distress. All risks, losses and costs associated with investing, including total loss of principal, are your responsibility. The views and opinions expressed in this article are those of the authors and do not necessarily reflect the official policy or position of FXStreet nor its advertisers. The author will not be held responsible for information that is found at the end of links posted on this page.
If not otherwise explicitly mentioned in the body of the article, at the time of writing, the author has no position in any stock mentioned in this article and no business relationship with any company mentioned. The author has not received compensation for writing this article, other than from FXStreet.
FXStreet and the author do not provide personalized recommendations. The author makes no representations as to the accuracy, completeness, or suitability of this information. FXStreet and the author will not be liable for any errors, omissions or any losses, injuries or damages arising from this information and its display or use. Errors and omissions excepted.
The author and FXStreet are not registered investment advisors and nothing in this article is intended to be investment advice.