

XRP price fall below $1 has put support levels under the spotlight. The token has fallen below the $0.99 lower boundary of the channel highlighted on Ali Charts’ three-day chart, while derivatives data indicates traders are cutting back on exposure.
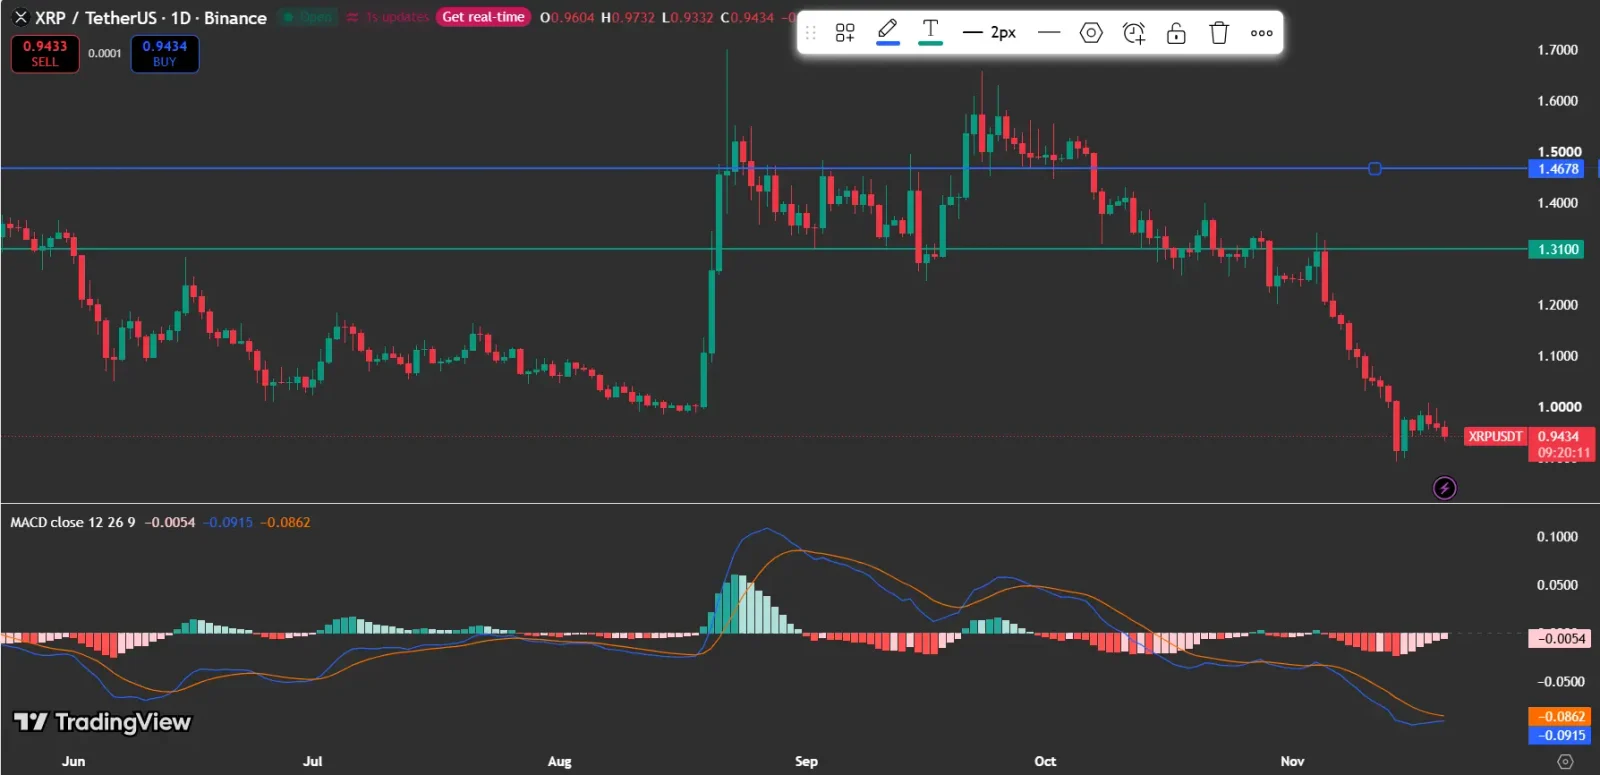
At press time, according to CoinMarketCap, XRP was trading at $0.9412, with a 4.57% change over the past 24 hours. Meanwhile, the Binance XRP/USDT chart on TradingView showed $0.9434. Its latest daily candle opened at $0.9604, reached a high of $0.9732 and recorded a low of $0.9332.
Also Read: National Bank of Canada Reveals XRP ETF Holdings as XRP Price Setup Improves
Why Did XRP Price Fall Below $0.99?
In an X post, Ali Charts (@alicharts) drew attention to the breakdown, describing $0.99 as the channel’s lower boundary. The analyst named $0.80 and $0.64 as the next support levels, stating, “The next major support levels I’m watching are $0.80 and $0.64.”
The analyst also explained, “For the bearish outlook to weaken, XRP would need to reclaim $0.99 as support.”
A rebound above $0.99 would indicate that buyers are taking back control. In the meantime, the lower levels remain reference points for traders gauging downside risk.
XRP BREAKS KEY SUPPORT LEVEL$XRP has broken below the $0.99 lower boundary of the channel, suggesting that a deeper correction may now be underway.
The next major support levels I’m watching are $0.80 and $0.64.
For the bearish outlook to weaken, XRP would need to reclaim… https://t.co/xpgY9CnbxM pic.twitter.com/egnZsgwXiP
— Ali Charts (@alicharts) November 20, 2026
Also Read: Raymond James Discloses XRP ETF Holdings as XRP Price Outlook Gains Attention
What Does TradingView Reveal About XRP Price Momentum?
The TradingView chart displays a decline from the September highs, when XRP was trading near $1.50. Selling picked up in November, driving the price under $1 and down toward $0.94.
The MACD line reads -0.0915, below the signal line at -0.0862, while the histogram is negative at -0.0054. Both lines sit below zero, which reinforces the bearish picture. The indicator does not determine how extensive the correction might become.
How Does CoinGlass Data Add to XRP Price Pressure?
Over the period shown, CoinGlass‘s four-hour liquidation chart shows roughly $485.6 million in long liquidations alongside $106.9 million in short liquidations. Long positions made up 82% of the total, indicating that leveraged bullish traders accounted for the majority of forced closures.
CoinGlass recorded the largest single liquidation bar at $29.9 million on November 9 at 01:30. As leveraged positions close, liquidations can intensify volatility, though the chart does not prove that they alone were responsible for XRP’s decline.
Also Read: XRP Wallet Accumulation Strengthens Despite the XRP Price Falling Toward $1
Does Declining XRP Open Interest Add to XRP Price Pressure?
CoinGlass’s open-interest chart indicates that total XRP futures open interest fell from about $3.6 billion in late September to roughly $1.85 billion by November 20. This points to a decline in the dollar value of outstanding futures positions alongside XRP’s falling price.
Declining open interest may reflect traders closing out positions. However, because the chart displays open interest in USD, part of the decline may also reflect XRP’s lower valuation rather than an equivalent reduction in the number of open contracts. On its own, the metric does not indicate whether the market has hit a bottom.
Combined with the liquidations and negative MACD, the data shows that the sell-off coincided with pressure across the derivatives market.
Can the XRP Price Recover $0.99?
The $0.99 level serves as the first threshold for recovery. A sustained move above it would challenge the breakdown identified by Ali Charts and might undermine the bearish setup.
Should XRP stay below that level, traders may keep watching $0.80 and $0.64 as possible support zones. The chart and derivatives data suggest continued pressure, but they do not confirm what will happen next. Cryptocurrency markets remain highly volatile, so traders should watch price action, market sentiment, and upcoming catalysts before making investment decisions.
Also Read: XRP Price Eyes Potential Breakout as Whale Activity Signals Momentum
This article contains market analysis and price predictions. These are not guarantees. Crypto markets are volatile. Always DYOR. Not financial advice.
